|
|||||
|
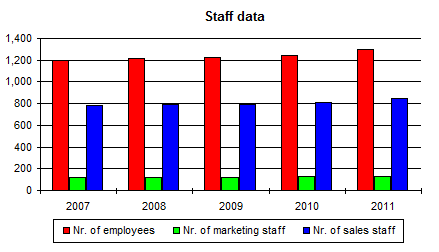
Samples of the 40 charts In the Overview worksheet there are seven charts (staff data, market data, market size, product data, sales volume per product line, turnover per product line, gross profit vs net profit) for five years:
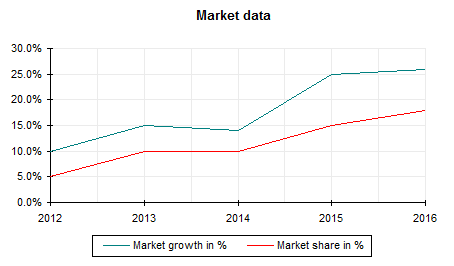
Displays the market growth and share % for five years:
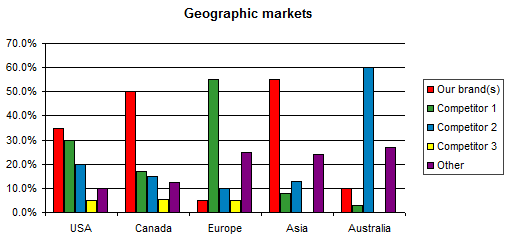
In the Target markets worksheet there is the chart for the geographic markets:
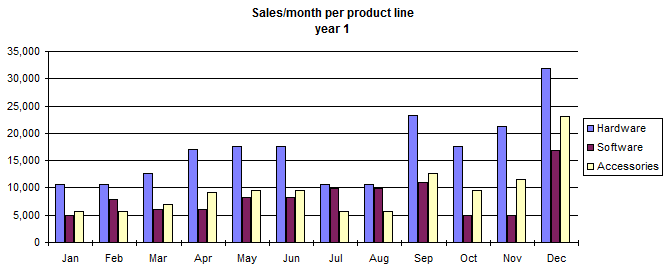
Displays the sales per month per product line during the first year:
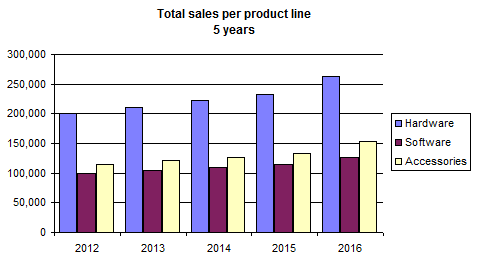
Displays the sales per product line for five years. Tables and charts for a three years projection are available as well:
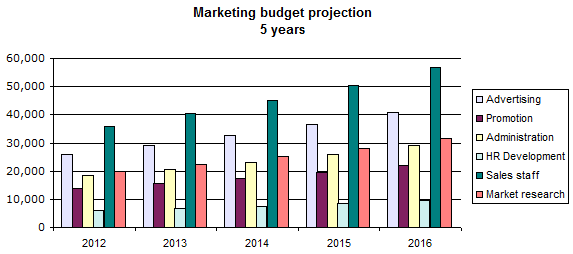
Displays the marketing budget projection for five years:
|
|||||
|
|||||